Russian
GNUplot Demonstrations
Contents Back Next
errorbar gnuplot demo #
# $Id: errorbar.dem%v 3.38.2.114 1993/04/15 01:48:40 woo Exp woo $
#
# 31 Mar 1993 Modified by Daniel S. Lewart (d-lewart@uiuc.edu)
#
set xrange [-3:65]
set yrange [ 4:14]
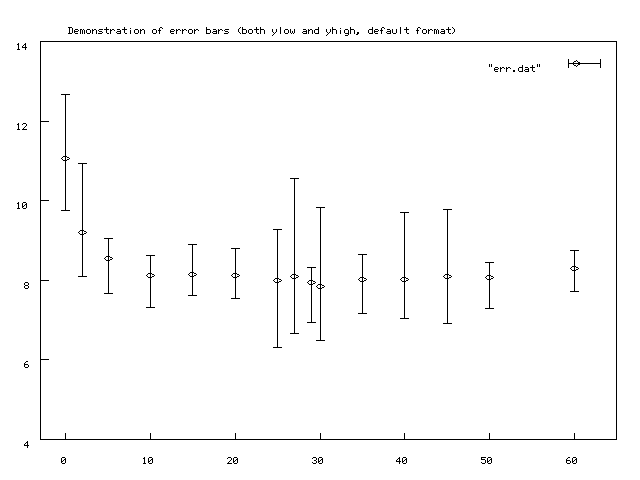
set title "Demonstration of error bars (both ylow and yhigh, default format)"
plot "err.dat" with errorbars
will result in (gif mode)
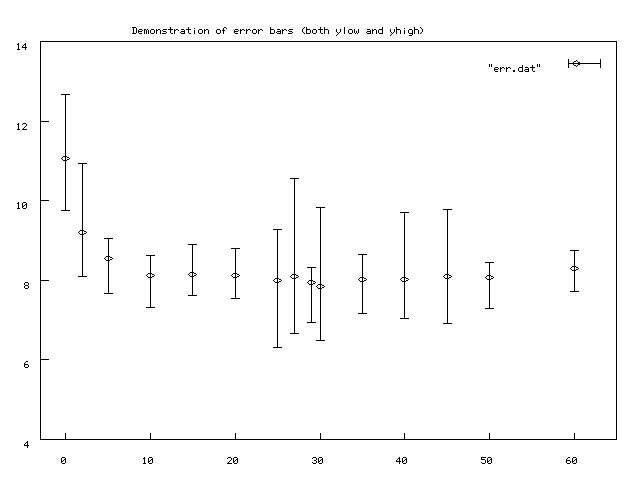
# this should look the same
set title "Demonstration of error bars (both ylow and yhigh)"
plot "err.dat" using 1:2:3:4 with errorbars
will result in (gif mode)
set title "Demonstration of boxes"
plot "err.dat" with boxes
will result in (gif mode)

set title "Demonstration of boxerrorbars"
plot "err.dat" with boxerror
will result in (gif mode)

set title "Demonstration of xybars"
plot "err.dat" using 1:2:3:4:5  with xybars
will result in (gif mode)

set autoscale
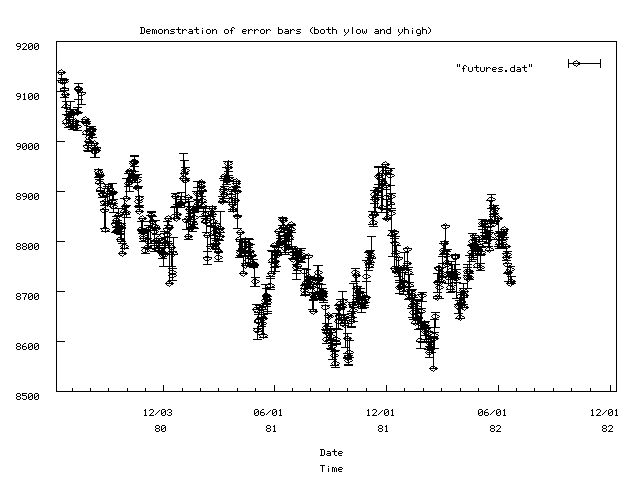
set title "Demonstration of error bars (both ylow and yhigh)"
set xlabel "Date\nTime"
set timefmt "%y%m%d"
set xdata time
set key right
set format x "%m/%d\n%y"
plot "futures.dat" using 2:3:4:5 with errorbars
will result in (gif mode)
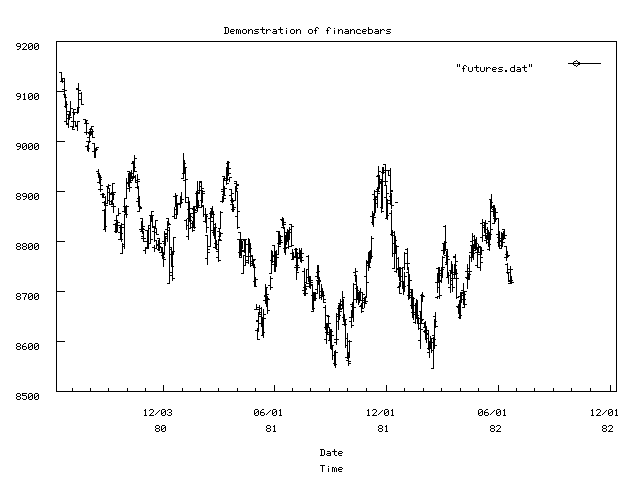
set title "Demonstration of financebars"
plot "futures.dat" using 2:3:4:5:6  with financebars
will result in (gif mode)
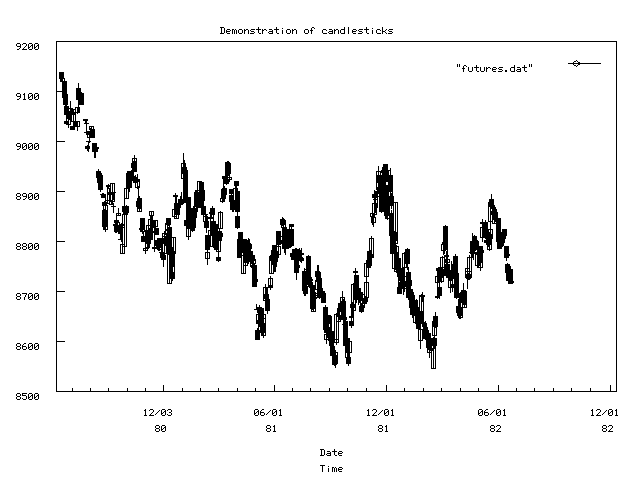
set title "Demonstration of candlesticks"
plot "futures.dat" using 2:3:4:5:6  with candlesticks
will result in (gif mode)
set xrange [-3:65]
set yrange [ 4:14]
set timefmt ""
set xdata ""
set xlabel ""
set format x ""
set tics


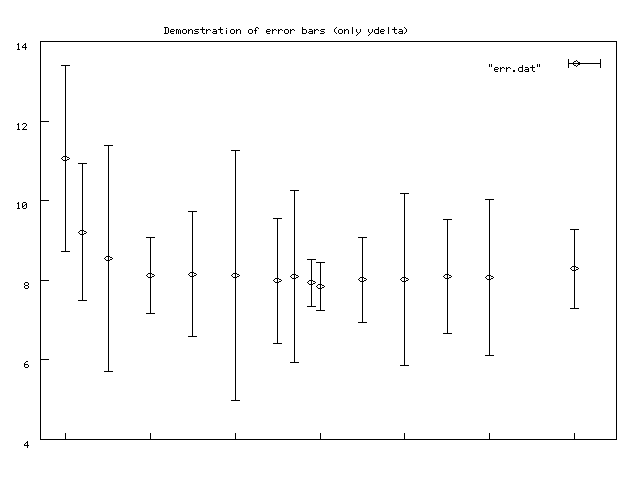
set title "Demonstration of error bars (only ydelta)"
plot "err.dat" using 1:2:5 with errorbars
will result in (gif mode)
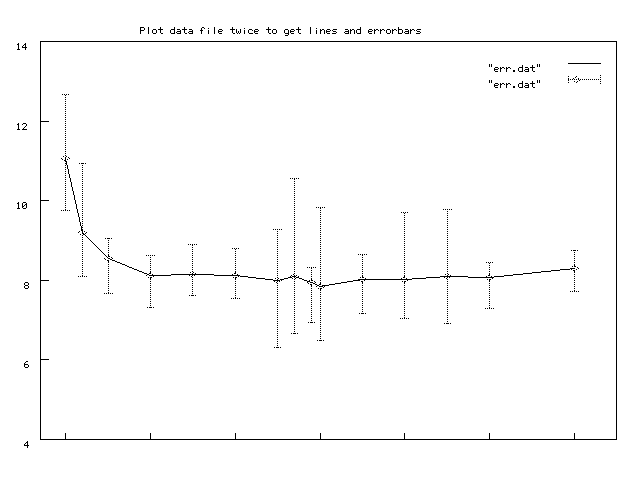
set title "Plot data file twice to get lines and errorbars"
plot "err.dat" with lines, "err.dat" using 1:2:3:4 with errorbars
will result in (gif mode)
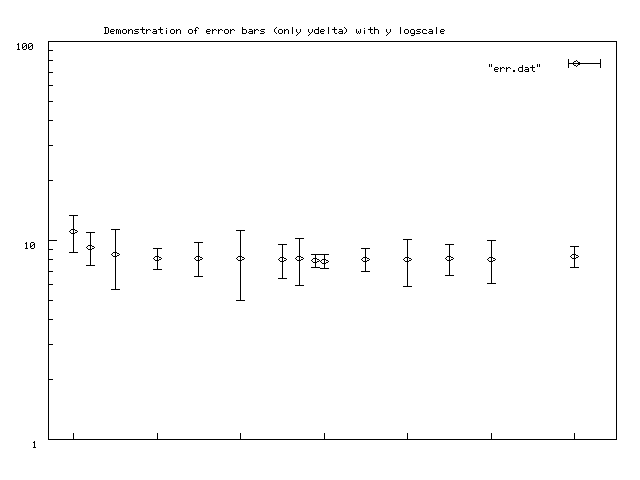
set logscale y
set title "Demonstration of error bars (only ydelta) with y logscale"
plot [-3:65] [1:100] "err.dat" using 1:2:5 with errorbars
set nologscale y
will result in (gif mode)
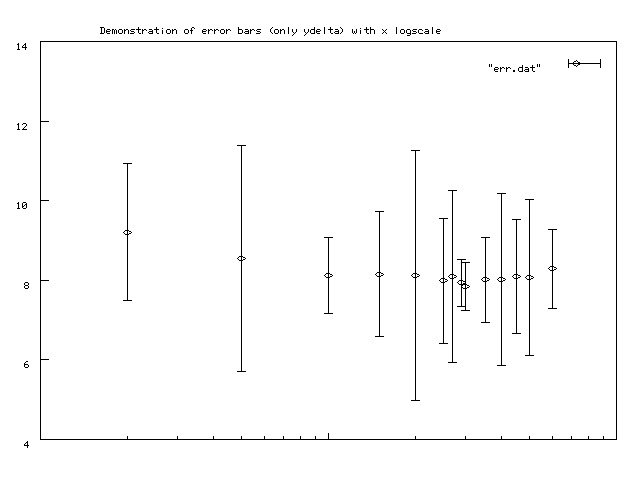
set logscale x
set title "Demonstration of error bars (only ydelta) with x logscale"
plot [1:100] [4:14] "err.dat" using 1:2:5 with errorbars
set nologscale x
will result in (gif mode)
set autoscale
set nologscale
set title ""
http://playfair.stanford.edu/~woo/woo.html
|
